There was some problem with my documents to start work at my research laboratory, so I had to stay in school for the first week to do research on flow cytometry to prepare me for my research work which will involve dealing with flow cytometry cell sorter... It's going to be an exciting SIP for me! hahaz.
Principle
It is a rapid technique that allows the analysis and identification of individual cells from a pool of heterogeneous sample population using multiple parameters.
Process of flow cytometry (Overview)
- Make a single cell suspension of the interested cell culture
- Use of antibodies bound with fluorochromes (PI) that is cell specific and incubate before washing (May involve use of multiple different specificity types of antibodies at any one time for flow cytometry)
- The sample is then loaded onto the flow cytometry
- Before using the flow cytometry, it is required to warm up the laser
- The sample is pressurized upwards or downwards depending on the type of hydrodynamic focusing used (sheath fluid is used to propel the sample into the flow chamber where the laser is located)
- The sample pass through the flow chamber where it is restricted to a single cell file flow
- A laser beam (normally an argon-ion laser is used) is focused on the cell flow, in the flow chamber, where cells with bound antibodies will have the fluorochromes attached excited into giving off light (depending on the type of flurorchromes used)
- The light scattered is collected by the orthogonal collection lens, which has a high numerical aperture for maximum fluorescence collection possible, to be measured by the photomultipliers where it is amplified and processed for analysis in the computer through digital conversion
- If the interested cell is identified, the flow chamber is charged at the moment of cell droplet formation (eg. Negative charged)
- The droplets are then pass through a pair of charged plates
- The charged plates function to deflect and collect different charged cell droplets
- The droplet with the interested cell is deflected towards the positive charged plate and collected into collection vessels for further analysis or use
Applications:
- Immunophenotyping
- Ploidy analysis
- Cell counting
- GFP expression analysis
Basic overview of the flow cytometry setup
The components are:
- Fluidics system
- Optics
- Signal detection and processing
- Electrostatic cell sorting (For flow cytometry equipped with cell sorting capabilities)
Fluidics system
It is a flow system that employs a concept of prssurized flowing fluid, shealth fluid, for single cell line presentation to the interrogation point and removes the waste into the waste container at the end of the flow.
Sheath fluid: usually an isotonic saline solution with the purpose of propelling the sample into the flow chamber.
The presentation of a line of single cells to the interrogation point is termed: hydrodynamic focusing
 Figure 1.1: Hydrodynamic focusing of the sample core through a flow cell

Figure 1.2: Hydrodynamic focusing of the sample core through a nozzle tip
Taken from: http://www.stemcell.umn.edu/img/assets/10061/Intro_to_Flow_Cytometry_Learning_Guide.pdf
Interrogation point
The point of intersection between the laser beam and the sample delivered in the flow chamber.
Optics
The system in the flow cytometry that is concern with manipulating the properties of light for signal detection and processing.
Light source
Blue light argon-ion laser = 488nm
UV laser = 360-380nm
Three main points:
- Light beam focusing
- Light collection
- Optical filters
Light beam focusing
Laser beam use optic lens to focus the intensity of the beam onto the sample stream where a cross-section of 50um laser beam is commonly set-up.
A flat-topped beam is commonly used for flow cytometry system in order to give a uniform lighting of the moving cells.
 Figure 2: Cross-sectioned laser beam focused by laser optics lens
Taken from: http://biology.berkeley.edu/crl/flow_cytometry_basic.html
Light collection
The collection lens is required to have a high numerical aperture value for maximum collection of the low fluorescence and other light signals from cells.
Optical filters (Not important)
Not use for monochromatic light from lasers. They are used for arc lamp that requires filtration to give the right excitation light wavelength for appropriate fluorescent dyes; however, these are rarely used now.
Signal detection and processing
Signal detection
There are three types of light to be detected by a light detector:
- Forward scatter light (also known as low-angle light)
- Side scatter light
- Fluorescent signals
Forward scatter light
The measurement of the degree of forward scatter light is approximately proportional to the cell size. Therefore, the larger the cell, the larger the degree of forward scatter light detected.
These can be used to differentiate cells with different cell sizes:
- Red blood cell (6um)
- Lymphocyte (8um)
- Neutrophil (12um)
- Monocyte (14um)
 Figure 3: Picture of a forward scatter light detector with an obscuration bar in front on the right side of the picture
Taken from: http://probes.invitrogen.com/resources/education/tutorials/4Intro_Flow/player.html
Side scatter light
The measurement of the degree of the side scatter light signal is approximately proportional to the granularity and structural complexity intracellularly.
These can be used to differentiate cells with varying granularity and structural complexity:
- Lymphocytes (low intracellular complexity)
- Monocytes (higher intracellular complexity)
- Granulocytes (highest intracellular complexity)
 Figure 4: Picture of a side scatter light from a cell
Taken from: http://probes.invitrogen.com/resources/education/tutorials/4Intro_Flow/player.html
Fluorescent signals
These involve the use of antibodies coupled fluorescent molecules that are excited with the right laser wavelength in the flow cytometry and gives off a fluorescence signal.
Types of Fluorochromes used (excitation at 488nm):
Label Proteins:
Fluorescein Green color
R-phycoerythrin (PE) Orange color
Phycoerythrin-Texas Red conjugate (ECD) Red color
Phycoerythrin-cyanine5 conjugate (Cy-chrome) Deep red
Conjugated peridinin chlorophyll (PerCP) Deep red
Label DNA:
Propidium iodide (PI) Red color

Figure 5: Fluorescent dyes and their properties
Taken from: http://www.ab-direct.com/uploads/Flow-Cytometry.pdf
Optical filters
They are dichroic filters which are used for detection of many signals simultaneously.
Dichroic filters acts as a filter and a mirror: allows light wavelength of specific length to pass through while reflect the remaining blocked light to specifc light detectors.
There are three types of dichroic filters:
- Long pass filter
- Short pass filter
- Band pass filter
Long pass filter
Blocks light below cut-off wavelength and transmit the light above that specific wavelength.
Short pass filter
Blocks light above cut-off wavelength and transmit the light above that specific wavelength.
Band pass filter
Block light below and above a certain specific cut-off wavelength and transmit the light from that narrow wavelength.

Figure 6: Diagram of the properties of different filters (shaded area is the light wavelength allowed to be transmitted through the filter)
Taken from: http://probes.invitrogen.com/resources/education/tutorials/4Intro_Flow/player.html
Signal processing
The lights detected from the each of the light detectors are converted into voltage pulse and this data is transfer into a computer program to be analysis. Figure 7: Diagram of the process of signal detection to processing
Taken from: http://www.ab-direct.com/uploads/Flow-Cytometry.pdf
Electronics and peripheral computer system
As the light signals detected are normally too small to be plotted on a graph, they have to be amplified first. These are done by a chain of linear or logarithmic amplifiers in a computer program before plotted on a graph, histogram.
There are three types of amplification:
- Logarithmic amplification/scaling
- Linear amplification/scale
- Biexponential amplification/scaling
Logarithmic amplification
It amplifies weak signals and constricts strong signals so that they are evenly distributed to be plotted on a histogram. It is commonly used for fluorescence analysis.
Linear amplification
Unlike logarithmic amplification, linear amplification is used for a narrow range of signals so that the data could be seen clearly on the histogram. It is commonly used for DNA studies.
Biexponential amplification
It is a combination of logarithmic and linear scale at the upper end and lower end respectively which is also used on the graph for flow cytometry. Figure 8: Comparing the difference in using linear and log scaling for fluorescence analysis
Taken from: http://probes.invitrogen.com/resources/education/tutorials/5Data_Analysis/player.html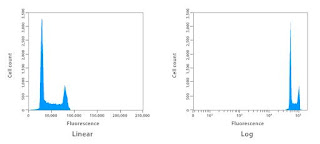 Figure 9: Comparing the difference in using linear and log scaling for DNA analysis
Taken from: http://probes.invitrogen.com/resources/education/tutorials/5Data_Analysis/player.html
Electrostatic cell sorting
This is an extended function of flow cytometry with the capabilities to sort the cells according to the data inputted into the computer system on the cells of interest as the selection criteria.
This application consists of three parts:
- Droplet formation
- Droplet charging
- Deflection plate (voltage plates)
Droplet formation
It is important to form droplets of approximately equal sizes to achieve only the formation of droplets which only contain one cell each for the purpose of accurate cell sorting. This is done through the high vibration of the nozzle part in the fluidics system where the fluid exits.
Droplet charging
When the droplet which contain the single cell of interest which fits the selection criteria. The fluid stream is charged at the precise ‘break-off point’ during the droplet formation.
Break-off point
It defines the moment where the droplet contains the cell of interest is formed and detaches from the fluid stream.
Deflection plate
After the charged droplet containing the cell of interest is release from the fluidics system and drip down towards the compartment containing the plates where it will be deflected left or right, depending on the charge. Non-charged droplets will just drip down into the waste container located right below the nozzle.

Figure 10: Diagram of the process of electrostatic cell sorting based on droplet charge
Taken from: http://www.ab-direct.com/uploads/Flow-Cytometry.pdf
(OH and ya, I absolutely hate blog posting, cause I am a blog idiot..! Posting a blog is such a frustrating task!
If only they have an attachment file tab, then I could attach microsoft word directly to each posting instead of spending my time trying to organise my documents which never fail to end up in a mess after I copy pass from my microsoft word document!!!)
Reference List:
1. Misha Rhaman. (2006). AbD SEROTEC. Introduction to Flow Cytometry. Retrieved June 29, 2008, from http://www.ab-direct.com/uploads/Flow-Cytometry.pdf
2. Nicoll, A. K. (2004). University of Dundee. SLS Flow Cytometry Core Facility: What is Fluorescent Activated Cell Sorting (FACS)? Retrieved June 29, 2008, from http://www.dundee.ac.uk/lifesciences/FACS/cell_sorting.htm
3. Invitrogen. (2008). Introduction to Flow Cytometry. Retrieved June 29, 2008, from http://probes.invitrogen.com/resources/education/tutorials/4Intro_Flow/player.html
4. Invitrogen. (2008). Data Analysis for Flow Cytometry. Retrieved June 29, 2008, from http://probes.invitrogen.com/resources/education/tutorials/5Data_Analysis/player.html
5. BD Bioscience. (2000). Introduction to Flow Cytometry: A Learning Guide. Retrieved June 29, 2008, from http://www.stemcell.umn.edu/img/assets/10061/Intro_to_Flow_Cytometry_Learning_Guide.pdf
By: Low Quan Jun 0607243C TG02 (Post: 29 June 2008 Edited: 04 July 2008)
2 comments:
July 1, 2008 at 9:45 PM
hey QJ, hopefully the glitch has been fixed (:
i'm curious about the Biexponential amplification. it is a combination of both log and linear right, why do they still use Logarithmic amplification and Linear amplification? why not standardize all amplifications using the biexponential?
take care!
Nurathirah
Tg01
July 7, 2008 at 9:44 AM
To Nurathirah:
Sorry for the late reply.
About your question. First thing to note is that amplifications are under the topic of data analysis for Flow Cytometry.
During the data collection, log amplification, scaling, is always used for normal fluoroscence signals whereas linear amplification, scaling, is always used for DNA fluoroscence signals.
Biexponential amplification, scaling, is just for display purpose. Example, it is used in "compensation", for spectral overlap, to observe if "compensation" is done properly.
What is "compensation" and spectral overlap? Confused? No worries, I will post another topic regarding it soon. FACS is quite complicated. So don't worry if you don't get what I mean now. I am also still learning about the whole complex process of Flow Cytometry, hahaz.
Here is one website you could visit that might aid in your understanding:
http://www.invitrogen.com/site/us/en/home/support/Tutorials.reg.sg.html
Many thanks for your question!
Quan Jun
TG 02
Post a Comment