Week 7

Hi all, for the past 3 weeks, I was attached to the haematology lab. Like other clinical labs, it operates 24 hours and is very busy almost everyday. The most common test ordered is full blood count, but since sofie has already touched on it, I shall talk about other tests.

Before that, do you know how specimens reach the lab? All along I thought they were sent in by some medical staff every now and then. But one day when I was helping out at the reception, I realised it was not. The specimens are received in the lab via a pneumatic transport system (that looks like water pipes) that is linked from every single ward or clinic to the lab. Samples from the wards to be sent to the lab are placed into a capsule, which contains a micro-chip that is recognised by the system to direct its way to its destination. In every ward or clinic, there will be this cupboard that contains the ‘pipe’. Empty capsules with reports from the lab (if available) will then be sent back to the respective wards using the same system. But because there is only one lane for sending out, the destination code must be keyed to ensure that they are sent back to the correct place. Isn’t this interesting? The WHOLE hospital is connected by all these ‘pipes’.

Capsules arriving from wards


Capsules waiting to be sent back to clinics/wards


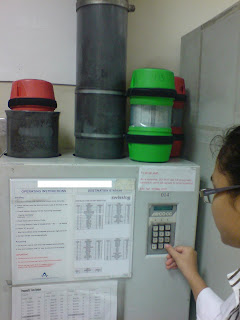
Sending back capsules with reports through the one and only lane
(destination code keyed)


Ok, back to haematology. ESR (Erythrocyte Sedimentation Rate) is one of the most common tests performed in the haematology lab. There are many ways to test for the ESR. In my lab, the sedi-rate P4-Micro System is used. It measures the rate at which red cells fall in the first 50 mins when anti-coagulated blood is allowed to stand. Red cell sedimentation occurs in 3 stages: in the preliminary stage where aggregates form within a few minutes. This is followed by a period of time in which the sinking of the aggregates takes place at a constant speed. Finally, as the aggregated cells pack together at the bottom of the test tube, sedimentation rate slows down.

ESR is used to help diagnose conditions associated with acute and chronic inflammation. When inflammation is present in the body, certain proteins cause red blood cells to stick together and fall more quickly than normal to the bottom of the tube. These proteins may be produced when there an infection, autoimmune disease, or cancer. However, ESR is said to be nonspecific because increases do not indicate the exact site of inflammation or the causative agent. For this reason, a sedimentation rate is done in conjunction with other tests to confirm a diagnosis. Once a diagnosis has been made, a sedimentation rate can be done to help check on the disease or see how well treatment is working.
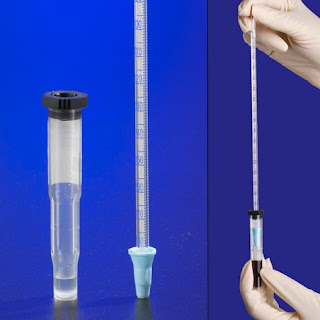
To perform ESR:

1. 320µl of blood is transferred into an aquisel tube, which contains 0.08ml of sodium citrate.
2. Then, a thin pipette is being pushed downwards into the tube, until the blood fills the whole pipette, indicated by the ‘0’ marking.
3. Next, the tube with pipette will be allowed to stand.
4. Exactly after 50 mins, the number of mm the red cells fallen would be read.
5.Results are then recorded in the ESR record book and the request form, and entered manually into the LIS.


Another special test that I think relates to what we have learnt is the Kleihauer Betke Test (KB), which is used to detect the presence of foetal RBCs in the mother’s blood using the principle of acid elution (dissolving of cells). KB Test can be used to assess 3 conditions.

One of which is when a newborn baby is found to be anaemic. In this case, the test checks whether the baby’s blood had entered the maternal circulation. If positive, the amount of blood must be determined and from there, the doctor will be able to decide how much blood should be transfused.

The second condition is, when the mother is Rh(-ve) and baby is Rh(+). If the KB test reflects a positive result, rhogam must be administered within 72 hours to neutralize the foetal RBCs.

Also, KB test plays an important part in cytogenetic analysis. To detect genetic abnormalities such as down syndrome, blood from unborn foetus must be analysed. To facilitate the process, the foetus’s blood must be taken through the mother’s tummy. The KB test will confirm whether the taken blood belongs to that of the foetus and not the mother.

Foetal RBCs contain mainly HbF (a2g2). They resist acid elution more than that of adult RBCs, which contain mainly HbA (a2b2). With this principle, foetal cells can take up the eosin when counterstained and appear as darkly stained red cells. On the other hand, adult cells will be disintegrated by the acid and therefore will appear as ghost cells (because the cells are dissolved, there is no more cells present to take up the stain).

To perform the KB test:

1. 3 different smears (patient’s blood, blood of a male and cord blood) are first made. Cord blood smear act as the positive control, blood smear from male acts as the negative.
2. Slides are air dried.
3. Slides are fixed in 80% ethanol for 10 mins then stained using the acid elution method.
4. This is followed by counterstaining with eosin for 3 mins and then air dried.
5. Finally slides are examined under the microscope at high power.

The proportion of foetal RBCs that appear as pinkish red intact cells to that of adult RBCs (appear as ghost cells) is assessed in several fields. If foetal cells are detected, report the number of foetal cells seen in 2000 adult cells and the volume will be calculated.


Ka Hang
TG02

Reply to Han Yang question from "Basic Introduction to Flow Cytometry"

Han Yang:

With regards to your questions, it would be understand best with pictures, so I decided to post a new entry for your questions, hope you don't mind.

1) 2 things:

  1. One of the most important precautions to take note is to make sure there are as few cell clumps as possible. As this will clot your flow cytometer, where the troubleshooting will make you seriously regret not removing the cell clumps if you didn’t.

  2. The next precaution relates more to the experiment design, if you want to isolate and sort a certain cell, you have to make sure you don’t have a lot of other unwanted cells in your sample (eg. RBCs, etc) or you are going to spend a long time sorting out the cells of interest due to very low % in your sample.
2) Lolz. I don’t mind sharing how the sample is load into the flow cytometer, you just place the sample tube on the “tube holder” on the “loading port” and load into the “sample injection chamber” of the flow cytometer by clicking on the "load" button on the "acquisition dashboard".
(Refer to figure 3 below for sample of "acquisition dashboard")


3) They are just some isotonic buffer solutions (eg. 1x PBS) that keep the cells structure intact for flow cytometry analysis. Some places even uses high grade DI water.

References:

4) Regarding the principle, I am not sure what principles are you talking about, but let me just show you the picture of how the lasers are focused onto the optical lens (also known as focusing lens):

Other than that, I think it’s best if I don’t touch on the principle too detailed as it relates to a whole new subject on physics (lasers). Let’s not make the learning confusing, okay? =)

Note: The display of some acquisition dashboard might vary a little, but they all basically have the same functions.

Hope my explanation is clear and help in your better understanding! =)

Quan Jun

6 weeks at SIP (Time sure flies)

Hey guys! Time sure pass with the speed of light, it’s already the end of 6th week! And it’s my turn to present to everyone this week.

Hope everyone is still doing well with your SIP and MP! =)

Today, I am going to be presenting on what I usually do in my SIP:
1. Daily Quality Control (QC) for FACSAria
a. This has to be done everyday to verify that the FACSAria is in optimal working condition

This involve 3 main steps:
1. “On” the computer before the FACSAria
a. 1 cycle of “fluidic startup” (primes the system of bubbles)
2. “Time delay” QC calibration (optimization)
3. “Area scaling” QC adjustment

Since step 1 is self-explanatory, I will skip straight to step 2:

Time Delay

· “Time delay” is required to adjust so that the signals obtained from the firing of different lasers at different timing are recognized to be from the same cells by the computer.
(Refer to figure 1, below)
· “Time delay” QC calibration is required to be done for all lasers, except for blue laser, which acts as a reference.
(In a flow cytometer, it is usually standard to have the red and blue lasers)


Steps:
1. Load a tube of DI water into the FACSAria to clean the sample line (Flow rate: 10)
2. Prepare a tube of approximately 500uL of rainbow beads solution
a. Rainbow beads contain mixed fluorescent signals (eg. FITC, PE and etc)
3. Load the rainbow beads tube into the FACSAria (Flow rate: 1)
4. Gate the cluster of dots on the dot plot for singlets
a. Singlets are always located on the low SSC and low FSC on the graph
(Shown below in figure 2)


5. Once “gated”, change the window extension to 0
6. Start optimizing the “time delay” of the laser by getting the peak of the signal as right as possible
a. If the value of “time delay” is not optimized, the peak of the signal is always to the left. (refer to figure 5)
b. After the “time delay” is optimized, change the window extension back to its original value


Window extension:
This relates to the pulse measured, as the pulse measured from the
beads is quite narrow, window extension is set to 0 so to capture
only the data of the pulse signal from the beads.


Area Scaling

· Area and height mean value must approximately match for all parameters (eg. FSC, SSC, FITC, PE and etc)
o Producing a linear line on the FSC-Area vs FSC-Height dot plot
· This is to standardize the parameters for accurate interpretation of experiment results.
· “Area scaling” is required to be done for all lasers.


Steps:
1. Using the same tube of rainbow beads, load it into FACSAria (flow rate: 1)
2. “Gate” the cluster of dots which represents the singlets
(Shown below, figure 8)


3. Adjust the values of the area scaling to increase or decrease the mean area-value to match approximately the mean height-value of the signals acquired using the population statistics (FSC-A, SSC-A, FITC-A and etc)
(Refer to figures 9, 10 and 11)
4. After the mean area to height value has been approximately matched, record the data of 1000 events by clicking the “Record Data” button on the “Acquisition Dashboard”.
(Refer to figure 12)


=== Sorry for the late posting, need to make sure I get my supervisor permission first before posting ===

Posted by:
Low Quan Jun
0607243C
TG02
Group 08
05 August 2008